monitoringsucks

Feb 13 2013

Love, MonitoringLove

Last year we were pretty negative about Monitoring, We shouted out that MonitoringSucked ... A year has passed and a lot has changed ... most importantly our new found love for monitoring, thanks to an inspirational Ignite talk by Ulf Mansson at devopsdays Rome.

Right after Fosdem about 20 people showed up at the #monitoringlove hacksessions hosted at the Inuits.eu offices to work on Open Source monitoring projects and exchange ideas. Some completely new people, some people with already a lot of experience.

Amongst the projects that were worked on was Maciej working on Packaging graphite for Debian, Ohter people were fixing bugs in Puppet , I spent some time with a vagrant box to deploy Sensu using Puppet. Last time I was playing with Sensu was on the flight back from PuppetCon , I gave up the fight with
RabbitMQ and SSL because I had no internet connection .. and now Ulf just pointed out that I could disable SSL at all, which resulted in having a POC up and running in no time.

Patrick was hacking on the Chef counterpart of the vagrant-puppet sensu setup a part of #monigusto. Ulf Mansson was getting dashing to display on a Raspberry Pi ... pretty cool stuff
And Jelle Smet was working on Pyseps a Python based Simple Event Processing Server framework that consume JSON docs from RabbitMQ and forwards them real time to other queues using MongoDB query syntax.

One of the more interesting discussion was around the topic of alerting and modeling business rules and input from a lot of different sources
in order to send the right alerts to the right people.

We explored different ideas like using BPM tools such as Activity or Rules engines like Ruby Rools. There exist some Saas providers that try to solve this need like PagerDuty and friends but obviously there is still a lot of work that needs to be done in order to create a viable alerting system based on different input sources.

The monitoring problem is not solved yet .. and it will stay around for a couple of years .. but with the advent of event such as Monitorama its clear
that an event like our #monitoring love hackessions is needed .. and is probably here to stay for a couple of years.

Feb 05 2013

check_graphite

During my Puppetcamp Gent talk last week, I explained how to get alerts based on trends from graphite. A number of people asked ,e how to do that.

First lets quickly explain why you might want to do that .
Sometimes you don't care about the current value of a metric..as an example take a Queing system .. there is no problem if there are messages added to the queue, not even if there are a lot of messages on the queue, there might however be a problem if over a certain period the number of messages on a queue stays to high.

In this example I`m monitoring the queue length of a hornetq setup which is exposed by JMX.
On the server runnnig HornetQ I have an exported resource that tells the JMXTrans server to send the MessageCount to graphite
(you could also do this using collectd plugins)

  1. @@jmxtrans::graphite {"MessageCountMonitor-${::fqdn}":
  2. jmxhost => hiera('hornetqserver'),
  3. jmxport => "5446",
  4. objtype => 'org.hornetq:type=Queue,*',
  5. attributes => '"MessageCount","MessagesAdded","ConsrCount"',
  6. resultalias => "hornetq",
  7. typenames => "name",
  8. graphitehost => hiera('graphite'),
  9. graphiteport => "2003",
  10. }

This gives me a computable url on which I can get the graphite view

The next step then is to configure a nagios check that verifies this data. For that I need to use the check_graphite plugin from Datacratic ..

Which can work with an nrpe config like

  1. ### File managed with puppet ###
  2. ### Served by: '<%= scope.lookupvar('::servername') %>'
  3. ### Module: '<%= scope.to_hash['module_name'] %>'
  4. ### Template source: '<%= template_source %>'
  5.  
  6. command[check_hornetq]=/usr/lib64/nagios/plugins/check_graphite -u "http://<%= graphitehost%>/render?target=servers.<%= scope.lookupvar('::fqdn').gsub(/\./,'_')%>_5446.hornetq.docstore_private_trigger_notification.MessageCount&from=-30minutes&rawData=true" -w 2000 -c 20000

I define this check on the host where HornetQ is running as it then will map to that host on Icinga/Nagios rather than throw a host error on an unrelated host.

Nov 13 2012

#monitoringlove hackfest

The age of #monitoringsucks is over, we're now transitioning into a #monitoringlove period.

That however doesn't mean al the work is done, we still need to do a lot of work and a lot of people are working on a lot of stuff.

Therefore like last year we are opening up our offices again right after Fosdem for a #monitoringlove hackfest

That's right on february 4 and 5 a bunch of people interrested to fix the problem will be meeting , discussing and hacking stuff together in Antwerp. In short a #monitoringlove hackathon

Inuits is opening up their offices for everybody who wants to join the effort Please let us (@KrisBuytaert) know if you want to join us in Antwerp. We'll provide caffeine, wireless, chairs and some snacks.

Please register upfront at : http://monitoringlove2013.eventbrite.com/

Obviously if you can't make it to Antwerp you can join the effort on ##monitoringsucks on Freenode or on Twitter.

The location will be Duboistraat 50 , Antwerp
It is about 10 minutes walk from the Antwerp Central Trainstation
Depending on Traffic Antwerp is about half an hour north of Brussels and there are hotels at walking distance from the venue.

Plenty of parking space is available on the other side of the Park

Read last years report http://www.krisbuytaert.be/blog/we-didnt-fix-it to get an idea of what will happen...

PS. Yes I`m trying to get another event of the ground the days before Fosdem but I`m still awaiting confirmation of the venue ..

Aug 11 2012

Our #monitoringsucks rpm is repository available

Not only our Rubygems Builds have changed, but also my internal #monitoringsucks repository.

You might have noticed a variety of vagrant- projects on my github acount

http://github.com/KrisBuytaert/vagrant-ganglia
http://github.com/KrisBuytaert/vagrant-graphite
http://github.com/KrisBuytaert/vagrant-puppet-logstash,
Being the #monitoringsucks part of them. All of those Vagrant projects are basically my test setups to play with those new tools.

They contain a bunch of puppet modules that install and configure these tools. (Note that they mostly consist of
of git submodules to other puppet module repositories.

Given the fact that I also like to have my software cleanly installed from a package, that means that some of these tools had to be packaged, or I had to create a personal / internal repository which had packages from upstream that were hiding on the internet available.

I've forked of this repository off the internal Inuits epository so you all can also benefit from these efforts.
(You gotta love pulp :))

That means you can now install all of the above mentionned #monitoringsucks tool from our public repo on

  1. yumrepo { 'monitoringsucks':
  2. baseurl => 'http://pulp.inuits.eu/pulp/repos/monitoring',
  3. descr => 'MonitoringSuck at Inuits',
  4. gpgcheck => '0',
  5. }

Patches to both the Vagrant projects and the puppet modules are welcome ...

Feb 11 2012

The ultimate 2012 open source and devops conference

Kent Skaar pinged me last week , asking for feedback on Lisa'11 and input for Lisa 2012.

Thought I should share my advise to him with the rest of the world

So If I were to host an event similar to Lisa I'd had either
Jordan Sissel or Mitchell Hashimoto give the keynote because over the past 24 months those people have written more relevant tools for me than anyone else :)

I'd have someone talk about Kanban for Operations, There's 2 names that pop up Dominica DeGrandis and Mattias Skarin

I'd have the Ubuntu folks talk about JuJu and I'd have RI Pienaar talk about MCollective .. while you have RI have him talk about Hiera too. Have Dean Wilson carry RI's bags and put him unknowingly on a panel. (Masquerade it as a Pub with hidden cameras)

Obviously as #monitoringsucks you want to hear about new monitoring tools initiatives and how people are dealing with them , so you want people talking about Graphite, Collectd, Statsd, Sensu , Icinga-MQ And how people are reviving Ganglia and using that in large scale environments.

You want someone to demistify Queues, I mean .. who still knows about the differences between Active, Rabbit , Zero, Hornet and many other Q's ?

You want people talking about how they deal with logs, so talks about Logstash and Graylog2.

You want to cover Test Driven Infrastructure How do you test your infrastructure , someone to demystify Cucumber and Webrat , and talk about testing Charms, Modules, and Cookbooks.

Oh and Filesystems , distributed ones the Ceph, FraunhoverFS, Moose, KosmosFS, Glusters, Swifts of this world ... you want people to talk about their experiences , good and bad with any of the above, someone who can actually compare those rather than heresay stuff. :) With recent updates on what's going on in these projects.

Now someone please organise this for me :) In a warm and sunny place ... preferably with 27 holes next door , and daycare for my kids :)

PS. Yes the absence of any openstack related topic is on purpose .. that's for 2013 :)

Feb 10 2012

We didn't fix it

MonitoringSucks and we didn't fix it.

Earlier this week Inuits hosted a 2 day hackfest titled #MonitoringSucks. A good number of people with a variety of backgrounds showed up on monday morning. I don't know why but people had high expectations for this event , did they really expect us to fix the #monitoringsucks problem in a mere 2 days ?

Next to myselve we had Patrick Debois , Grégory Karékinian, Stefan Jourdan, Colin Humphreys, Andrew Crump, Ohad Levy , Frank Marien, Toshaan Bharvani, Devdas Bhagat, Maciej Pasternacki Axel Beckert Jelle Smet, Noa Resare @blippie , John John Tedro @udoprog, Christian Trabold @ctrabold and obviously some people I missed


A good mixture of Fosdem visitors that stayed a litte longer in our cold country and locals with ideas. We had people from TomTom, RedHat , Spotify, Booking.com, Inuits, Atlassian, coming from Belgium, The Netherlands France, Israel, the UK, Sweden, Germany, Poland and Switzerland if I`m not mistaken.

The format was pretty open, much of the first day was spend around the drawingboard.
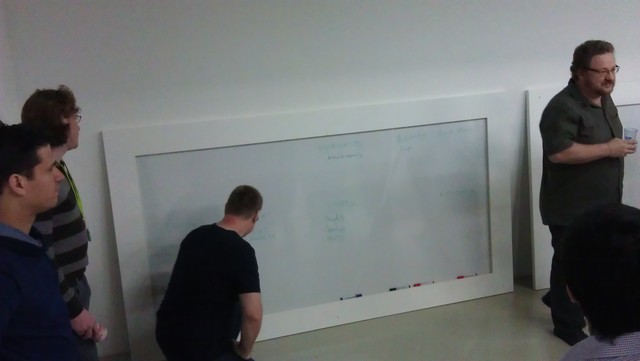
people around the drawingboard
(Ohad Levy, Jelle Smet, PatrickDebois and Frank Marien) discussing a variety of topics

This monitoring topic is complex, there are different areas that need to be covered. The drawing below documents how we splitted the problem into different areas , and listed the different tools people use for these areas.
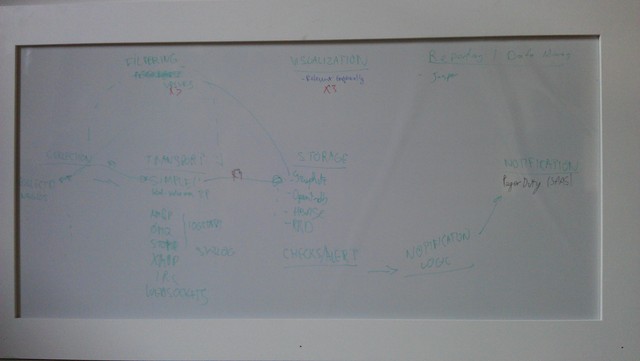
  • Collection: Collectd, Nagios, Ganglia
  • Transport: XMPP, Smiple, Smtp, 0mq , APMQ, rsyslog, irc, stomp
  • Storage : rrd, graphite, opentsdb, hbase,
  • Filtering: logstash, esper,
  • Visualisation : Graphite,
  • Notifcation: PagerDuty
  • Reporting: Jasper

Obviously above list is far from complete.
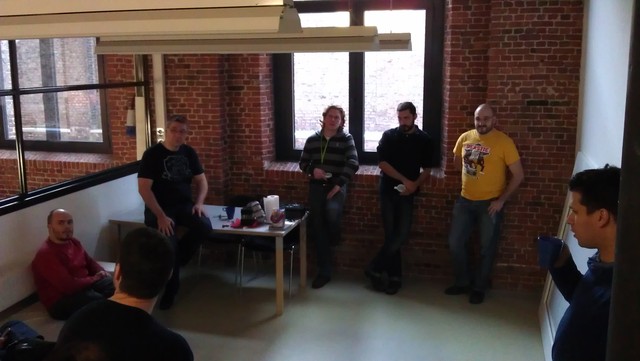


The afternoon discussion continued where we left of before lunch, just after the powercut. Only now we started refocussing on filtering and aggregating values using Logstash
@patrickdebois had been talking about the idea to use Logstash as a way to collect data , transform it and throw it either to another tool, or onto a Queue before.
Looking at Logstash it makes kind of sense. Logstash already has a zillion of input types, filters and outputs. Including popular queues such as amqp and zeromq. Yes, the default behaviour for a lot of people is to get data from different inputs, filter it and then send it to ElasticSearch, but much more is possible with the available outputs.
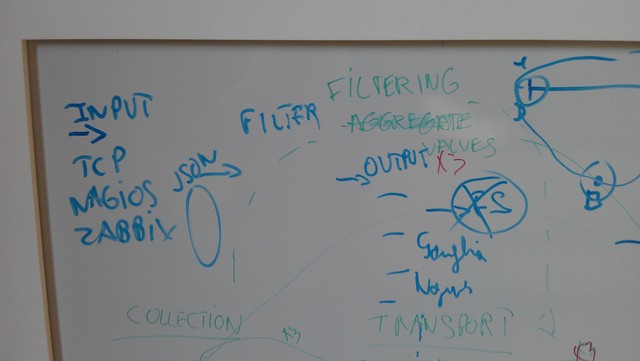


It was only on tuesday that people really started writing code
So what did really come out of the #monitoringsucks hackfest. ?

A couple of people were working on packaging existing tools for their favourite distro. Others were working on integrating a number of other already existing tools (e.g Patrick working on more inputs for Logstash., me working on replacing logster with Logstash, setting up Kibana etc. New tools were learned, items were added to todolists (Kibana, (doesn't work on older Firefox instances) Tattle, statsd) and items were scratched from todolists (Graylog2 (Kibana replaces that as a good Frontend for Logstash) )

A lot of experiences with different tools were exchanged

Frank Marien showed us a demo of his freshly release ExtremeMon framework. A really promising project.

The sad part about a workshop like this one is that you enter with a bunch of ideas , and leave with even more ideas, hence more work. We haven't solved the problem yet, but a lot of more people are now thiking about the problem and how to solve it a more modulare (unix style) approach. With different litte tools, all being good at something and all being interconnectable.

Feb 01 2012

#monitoringsucks hackathon 6&7 february Practical details:

As announced earlier next monday and tuesday we're opening up the Inuits offices for everybody working on monitoring problems.

There's already a good number of people that have confirmed their presence and some people have asked

As for practical details .. the plan is simple.
I`m going to be at the place somewhere between 8:30 and 9:00 on monday. ( Hey .. it's the day after Fosdem you know :))

The only thing I've planned is to do a get to know eachother round around 10:30 after that I`m expecting the hackathon to be self organising,

There will be water, coffee , etc , IP connectivity, and electricity.

The location is still Duboisstraat 50, Antwerp

Free parking is on the Hardenvoort or Kempenstraat ( 3minutes walk) , paid parking right in front of the door.

Jan 03 2012

Graphite, JMXTrans, Ganglia, Logster, Collectd, say what ?

Given that @patrickdebois is working on improving data collection I thought it would be a good idea to describe the setup I currently have hacked together.

(Something which can be used as a starting point to improve stuff, and I have to write documentation anyhow)

I currently have 3 sources , and one target, which will eventually expand to at least another target and most probably more sources too.

The 3 sources are basically typical system data which I collect using collectd, However I`m using collectd-carbon from https://github.com/indygreg/collectd-carbon.git to send data to Graphite.

I`m parsing the Apache and Tomcat logfiles with logster , currently sending them only to Graphite, but logster has an option to send them to Ganglia too.

And I`m using JMXTrans to collect JMX data from Java apps that have this data exposed and send it to Graphite. (JMXTrans also comes with a Ganglia target option)

Rather than going in depth over the config it's probably easier to point to a Vagrant box I build https://github.com/KrisBuytaert/vagrant-graphite which brings up a machine that does pretty much all of this on localhost.

Obviously it's still a work in progress and lots of classes will need to be parametrized and cleaned up. But it's a working setup, and not just on my machine ..

Jan 03 2012

#monitoringsucks and we'll fix it !

If you are hacking on monitoring solutions, and want to talk to your peers solving the problem
Block the monday and tuesday after fosdem in your calendar !

That's right on february 6 and 7 a bunch of people interrested to fix the problem will be meeting , discussing and hacking stuff together in Antwerp

In short a #monitoringsucks hackathon

Inuits is opening up their offices for everybody who wants to join the effort Please let us (@KrisBuytaert and @patrickdebois) know if you want to join us in Antwerp

Obviously if you can't make it to Antwerp you can join the effort on ##monitoringsucks on Freenode or on Twitter.

The location will be Duboistraat 50 , Antwerp
It is about 10 minutes walk from the Antwerp Central Trainstation
Depending on Traffic Antwerp is about half an hour north of Brussels and there are hotels at walking distance from the venue.

Plenty of parking space is available on the other side of the Park