graphite

Jun 04 2014

Jenkins, Puppet, Graphite, Logstash and YOU

This is a repost of an article I wrote for the Acquia Blog some time ago.

As mentioned before, devops can be summarized by talking about culture, automation, monitoring metrics and sharing. Although devops is not about tooling, there are a number of open source tools out there that will be able to help you achieve your goals. Some of those tools will also enable better communication between your development and operations teams.

When we talk about Continuous Integration and Continuous Deployment we need a number of tools to help us there. We need to be able to build reproducible artifacts which we can test. And we need a reproducible infrastructure which we can manage in a fast and sane way. To do that we need a Continuous Integration framework like Jenkins.

Formerly known as Hudson, Jenkins has been around for a while. The open source project was initially very popular in the Java community but has now gained popularity in different environments. Jenkins allows you to create reproducible Build and Test scenarios and perform reporting on those. It will provide you with a uniform and managed way to , Build, Test, Release and Trigger the deployment of new Artifacts, both traditional software and infrastructure as code-based projects. Jenkins has a vibrant community that builds new plugins for the tool in different kinds of languages. People use it to build their deployment pipelines, automatically check out new versions of the source code, syntax test it and style test it. If needed, users can compile the software, triggering unit tests, uploading a tested artifact into a repository so it is ready to be deployed on a new platform level.

Jenkins then can trigger an automated way to deploy the tested software on its new target platform. Whether that be development, testing, user acceptance or production is just a parameter. Deployment should not be something we try first in production, it should be done the same on all platforms. The deltas between these platforms should be managed using a configuration management tool such as Puppet, Chef or friends.

In a way this means that Infrastructure as code is a testing dependency, as you also want to be able to deploy a platform to exactly the same state as it was before you ran your tests, so that you can compare the test results of your test runs and make sure they are correct. This means you need to be able to control the starting point of your test and tools like Puppet and Chef can help you here. Which tool you use is the least important part of the discussion, as the important part is that you adopt one of the tools and start treating your infrastructure the same way as you treat your code base: as a tested, stable, reproducible piece of software that you can deploy over and over in a predictable fashion.

Configuration management tools such as Puppet, Chef, CFengine are just a part of the ecosystem and integration with Orchestration and monitoring tools is needed as you want feedback on how your platform is behaving after the changes have been introduced. Lots of people measure the impact of a new deploy, and then we obviously move to the M part of CAMS.

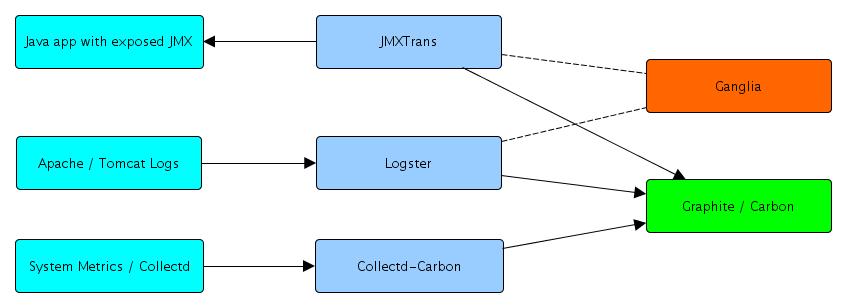
There, Graphite is one of the most popular tools to store metrics. Plenty of other tools in the same area tried to go where Graphite is going , but both on flexibility, scalability and ease of use, not many tools allow developers and operations people to build dashboards for any metric they can think of in a matter of seconds.

Just sending a keyword, a timestamp and a value to the Graphite platform provides you with a large choice of actions that can be done with that metric. You can graph it, transform it, or even set an alert on it. Graphite takes out the complexity of similar tools together with an easy to use API for developers so they can integrate their own self service metrics into dashboards to be used by everyone.

One last tool that deserves our attention is Logstash. Initially just a tool to aggregate, index and search the log files of our platform, it is sometimes a huge missed source of relevant information about how our applications behave.. Logstash and it's Kibana+ElasticSearch ecosystem are now quickly evolving into a real time analytics platform. Implementing the Collect, Ship+Transform, Store and Display pattern we see emerge a lot in the #monitoringlove community. Logstash now allows us to turn boring old logfiles that people only started searching upon failure into valuable information that is being used by product owners and business manager to learn from on the behavior of their users.

Together with the Graphite-based dashboards we mentioned above, these tools help people start sharing their information and communicate better. When thinking about these tools, think about what you are doing, what goals you are trying to reach and where you need to improve. Because after all, devops is not solving a technical problem, it's trying to solve a business problem and bringing better value to the end user at a more sustainable pace. And in that way the biggest tool we need to use is YOU, as the person who enables communication.

Feb 05 2013

check_graphite

During my Puppetcamp Gent talk last week, I explained how to get alerts based on trends from graphite. A number of people asked ,e how to do that.

First lets quickly explain why you might want to do that .
Sometimes you don't care about the current value of a metric..as an example take a Queing system .. there is no problem if there are messages added to the queue, not even if there are a lot of messages on the queue, there might however be a problem if over a certain period the number of messages on a queue stays to high.

In this example I`m monitoring the queue length of a hornetq setup which is exposed by JMX.
On the server runnnig HornetQ I have an exported resource that tells the JMXTrans server to send the MessageCount to graphite
(you could also do this using collectd plugins)

  1. @@jmxtrans::graphite {"MessageCountMonitor-${::fqdn}":
  2. jmxhost => hiera('hornetqserver'),
  3. jmxport => "5446",
  4. objtype => 'org.hornetq:type=Queue,*',
  5. attributes => '"MessageCount","MessagesAdded","ConsrCount"',
  6. resultalias => "hornetq",
  7. typenames => "name",
  8. graphitehost => hiera('graphite'),
  9. graphiteport => "2003",
  10. }

This gives me a computable url on which I can get the graphite view

The next step then is to configure a nagios check that verifies this data. For that I need to use the check_graphite plugin from Datacratic ..

Which can work with an nrpe config like

  1. ### File managed with puppet ###
  2. ### Served by: '<%= scope.lookupvar('::servername') %>'
  3. ### Module: '<%= scope.to_hash['module_name'] %>'
  4. ### Template source: '<%= template_source %>'
  5.  
  6. command[check_hornetq]=/usr/lib64/nagios/plugins/check_graphite -u "http://<%= graphitehost%>/render?target=servers.<%= scope.lookupvar('::fqdn').gsub(/\./,'_')%>_5446.hornetq.docstore_private_trigger_notification.MessageCount&from=-30minutes&rawData=true" -w 2000 -c 20000

I define this check on the host where HornetQ is running as it then will map to that host on Icinga/Nagios rather than throw a host error on an unrelated host.

Aug 11 2012

Our #monitoringsucks rpm is repository available

Not only our Rubygems Builds have changed, but also my internal #monitoringsucks repository.

You might have noticed a variety of vagrant- projects on my github acount

http://github.com/KrisBuytaert/vagrant-ganglia
http://github.com/KrisBuytaert/vagrant-graphite
http://github.com/KrisBuytaert/vagrant-puppet-logstash,
Being the #monitoringsucks part of them. All of those Vagrant projects are basically my test setups to play with those new tools.

They contain a bunch of puppet modules that install and configure these tools. (Note that they mostly consist of
of git submodules to other puppet module repositories.

Given the fact that I also like to have my software cleanly installed from a package, that means that some of these tools had to be packaged, or I had to create a personal / internal repository which had packages from upstream that were hiding on the internet available.

I've forked of this repository off the internal Inuits epository so you all can also benefit from these efforts.
(You gotta love pulp :))

That means you can now install all of the above mentionned #monitoringsucks tool from our public repo on

  1. yumrepo { 'monitoringsucks':
  2. baseurl => 'http://pulp.inuits.eu/pulp/repos/monitoring',
  3. descr => 'MonitoringSuck at Inuits',
  4. gpgcheck => '0',
  5. }

Patches to both the Vagrant projects and the puppet modules are welcome ...

Mar 23 2012

FlossUK and Puppetcamp Edinburgh

I've just finished presenting my talk on how I currently work on Puppet modules at Puppetcamp here in Edinburgh where I've been for the week talking on both FlossUK 2012 and Puppetcamp.

Earlier this week I opened FlossUK 2012 with my talk on 7 tools for your devops stack

Jan 03 2012

Graphite, JMXTrans, Ganglia, Logster, Collectd, say what ?

Given that @patrickdebois is working on improving data collection I thought it would be a good idea to describe the setup I currently have hacked together.

(Something which can be used as a starting point to improve stuff, and I have to write documentation anyhow)

I currently have 3 sources , and one target, which will eventually expand to at least another target and most probably more sources too.

The 3 sources are basically typical system data which I collect using collectd, However I`m using collectd-carbon from https://github.com/indygreg/collectd-carbon.git to send data to Graphite.

I`m parsing the Apache and Tomcat logfiles with logster , currently sending them only to Graphite, but logster has an option to send them to Ganglia too.

And I`m using JMXTrans to collect JMX data from Java apps that have this data exposed and send it to Graphite. (JMXTrans also comes with a Ganglia target option)

Rather than going in depth over the config it's probably easier to point to a Vagrant box I build https://github.com/KrisBuytaert/vagrant-graphite which brings up a machine that does pretty much all of this on localhost.

Obviously it's still a work in progress and lots of classes will need to be parametrized and cleaned up. But it's a working setup, and not just on my machine ..

Jan 03 2012

#monitoringsucks and we'll fix it !

If you are hacking on monitoring solutions, and want to talk to your peers solving the problem
Block the monday and tuesday after fosdem in your calendar !

That's right on february 6 and 7 a bunch of people interrested to fix the problem will be meeting , discussing and hacking stuff together in Antwerp

In short a #monitoringsucks hackathon

Inuits is opening up their offices for everybody who wants to join the effort Please let us (@KrisBuytaert and @patrickdebois) know if you want to join us in Antwerp

Obviously if you can't make it to Antwerp you can join the effort on ##monitoringsucks on Freenode or on Twitter.

The location will be Duboistraat 50 , Antwerp
It is about 10 minutes walk from the Antwerp Central Trainstation
Depending on Traffic Antwerp is about half an hour north of Brussels and there are hotels at walking distance from the venue.

Plenty of parking space is available on the other side of the Park