Graphite, JMXTrans, Ganglia, Logster, Collectd, say what ?
Given that @patrickdebois is working on improving data collection I thought it would be a good idea to describe the setup I currently have hacked together.
(Something which can be used as a starting point to improve stuff, and I have to write documentation anyhow)
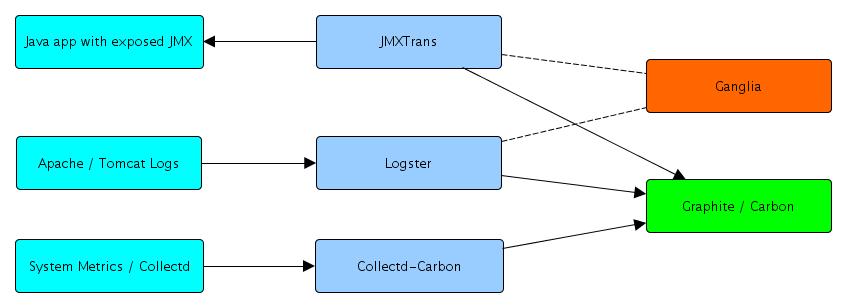
I currently have 3 sources , and one target, which will eventually expand to at least another target and most probably more sources too.

The 3 sources are basically typical system data which I collect using collectd, However I`m using collectd-carbon from https://github.com/indygreg/collectd-carbon.git to send data to Graphite.
I`m parsing the Apache and Tomcat logfiles with logster , currently sending them only to Graphite, but logster has an option to send them to Ganglia too.
And I`m using JMXTrans to collect JMX data from Java apps that have this data exposed and send it to Graphite. (JMXTrans also comes with a Ganglia target option)
Rather than going in depth over the config it's probably easier to point to a Vagrant box I build https://github.com/KrisBuytaert/vagrant-graphite which brings up a machine that does pretty much all of this on localhost.
Obviously it's still a work in progress and lots of classes will need to be parametrized and cleaned up. But it's a working setup, and not just on my machine ..

Comments
#1 Justin Ellison : What purpose is Ganglia filling for you?
Kris,
Thanks for posting all of this, it's helping me understand a lot about the current state of things. I'm tasked with replacing a Nagios 2.5 install that feeds perfdata to Cacti via custom perl code (yeah, I know).
I understand what every piece is doing for you in your diagram above, except for Ganglia. If you have everything sending metrics to Graphite, why duplicate that to Ganglia? Doesn't Graphite usually supplant Ganglia?
Finally, I don't see anything that's providing notifications on those metrics. Can you share what you use there?
Thanks again,
Justin
#2 Kris Buytaert : Dotted Lines and good points
The lines to Ganglia are dotted, which basically means I haven't implemented them. I`m planning on implementing them to see the differences between them and evaulate,
I heard things like use Graphite for realtime and Ganglia for archiving. But I`m also still figuring that out.
As for providing notifications on those metrics. I've seen Vladimir from Ganglia demonstrate that already .. I haven't gotten anything implemented there yet either. so that also is a part of my upcoming research.
#3 BOK : Puppet errors
Hi Kris,
On both CentOS 6.0 and 6.2 vagrantboxes, I get this error:
Puppet::Parser::AST::Resource failed with error ArgumentError: Invalid resource type yepo at /tmp/vagrant-puppet/manifests/hosts/graphite.pp:30 on node graphite
Any hints / clues?
What Vagrant box are you using (URL / veewee file)?
#4 Kris Buytaert : repo
obviously that was a typo that sneaked in after I had a tested version .
Obviously It should be repo.
Apart from that I should ask Dave Simons where he published the definition coz he built the box :)